Generative BI Is Not Just Text-to-SQL: Designing an Agentic Analytic Pipeline
What it takes to turn a plain-English question into trusted SQL, charts, and answers: context retrieval, tool calling, execution loops, and live pipeline visibility.
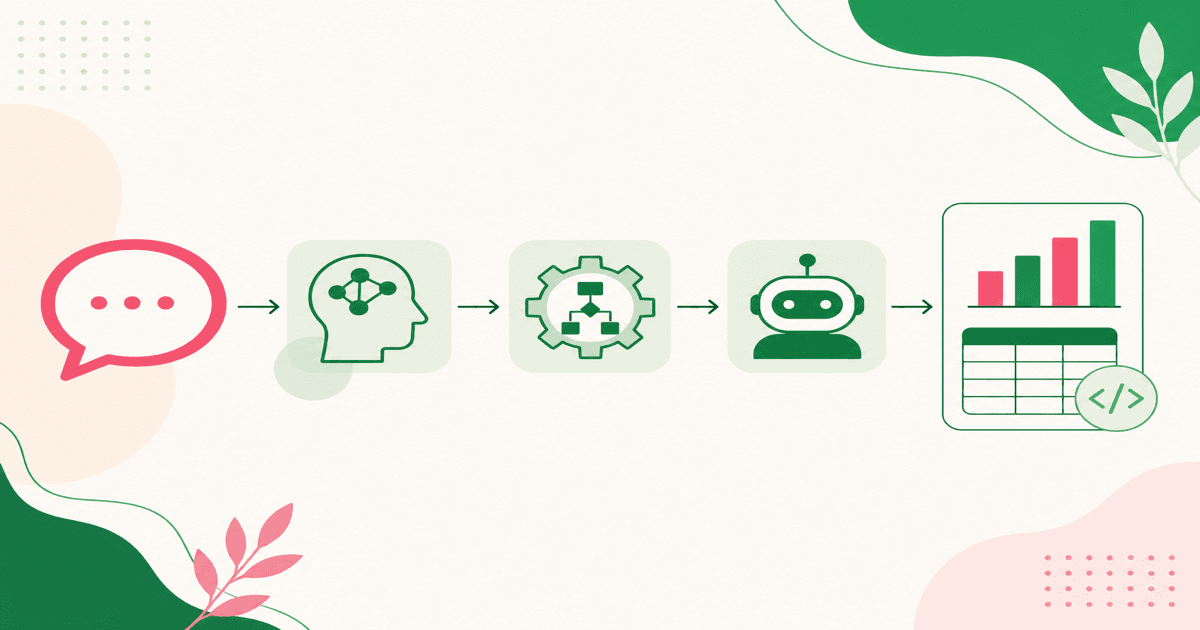
Ask a business user what they want from data, and they rarely say “write me a join across Orders and Order Details.” They say: What were total sales by year? or Who are our top customers by order volume?
That gap between natural language and executable analytics is where most “Text-to-SQL” demos look magical and most production attempts fall apart. I built Analytic Copilot to explore that gap properly. Not as a single prompt that emits SQL, but as an agentic pipeline that plans, retrieves schema context, generates code, executes it, visualizes results, and streams every step so you can see what the model is doing.
The hard part is not the SQL. The hard part is everything around the SQL.
The Real Problem With Naive Text-to-SQL
A one-shot prompt like “given this schema, write SQL for the question” fails in predictable ways:
- Schema overload. Dumping every table into the prompt burns tokens and confuses the model.
- Missing business rules. Revenue recognized on
ShippedDatevsOrderDateis not in the DDL. - No feedback loop. A bad join returns empty rows; the model never sees the failure.
- No presentation layer. Users need charts and summaries, not a raw result set.
- No trust. If you cannot inspect the plan, SQL, and assumptions, you will not ship it.
Generative BI needs a system that treats the LLM as a planner and coder inside a controlled loop, not as an oracle that “knows” your warehouse.
Concept 1: An Analytic Agent, Not a Chatbot
The core abstraction in Analytic Copilot is a smart agent with a persona, a tool list, and a conversation history. The persona is a data analyst: clarify the question, pull relevant context, write Python that queries SQLite, choose a chart, and explain the answer.
That sounds simple until you notice what the agent is not allowed to do. It does not talk to the database directly from free-form text. It must call tools. Two tools matter most:
retrieve_context: pull schemas, relationships, and business rules for the concepts in the question.execute_python_code: run analysis code in a sandbox that exposesexecute_sql_query()andshow_to_user().
Tool calling is the contract. The model proposes structured arguments; your runtime validates and executes them. That is the difference between “LLM wrote some SQL in a markdown fence” and “LLM drove a real analytic session.”
flowchart TD
    Q[User question] --> U[Understand]
    U --> P[Plan / persona]
    P --> C{Enough context?}
    C -->|No| R[Retrieve scenarios, tables, rules]
    R --> G[Generate Python + SQL]
    C -->|Yes| G
    G --> E[Execute against DB]
    E -->|Error| G
    E -->|Success| V[Table / chart]
    V --> A[Natural-language answer]
Concept 2: Metadata-Driven Context Retrieval
LLMs do not magically know that “sales by country” needs Orders, Order Details, and Customers, or that revenue is recognized on ship date. You have to encode analytic knowledge outside the model.
In Analytic Copilot that knowledge lives in a metadata file: analytic scenarios, table descriptions, columns, relationships, and rules. When the agent asks for context around “total sales” or “top products,” a second LLM call maps those business concepts to scenarios such as Customer Sales Analysis or Product Category Sales Trends, then assembles only the relevant tables and rules.
This is retrieval, but not classic document RAG. It is structured analytic RAG:
- Scenarios group related questions.
- Rules capture definitions finance and ops already argue about.
- Relationships tell the model how to join without guessing.
Narrow context beats full schema dumps. The agent reasons better when it sees five tables and two rules than when it sees the entire Northwind catalog.
Concept 3: Code as the Analytic Interface
Here is a design choice that surprised people who expected “SQL only”: the agent writes Python, and SQL is a function call inside that Python.
Why? Because real answers need more than SELECT. You filter, aggregate, reshape, and plot. A Python sandbox with execute_sql_query(sql) -> DataFrame and show_to_user(fig_or_df) gives the model a single interface for query, transform, and visualize.
The tool forces the model to declare:
- Assumptions: what it believes about the data
- Goal: what this snippet should achieve
- Code: complete, executable Python
Those three fields are gold for debugging. When the answer looks wrong, you inspect assumptions first, then the SQL buried in the code, then the chart choice.
Concept 4: The Execution Loop (Self-Correction)
Agents fail. Queries return empty frames. Column names are wrong. Plotly calls blow up. A production-minded pipeline treats failure as input, not as a dead end.
Analytic Copilot runs a bounded loop: call the model, execute tools, append tool results to the conversation, call again. Caps matter. Max runs per question, max consecutive execution errors, so a confused agent cannot spin forever. On repeated errors, history resets to the last user question so the model can retry cleanly instead of compounding bad tool turns.
This is the same idea as agentic coding loops, applied to BI: plan → act → observe → repair.
Without that loop, Text-to-SQL is a coin flip. With it, the system can recover from the mistakes that every warehouse query inevitably hits.
Concept 5: Personas and Strategy Switching
Not every question needs the same strategy. Analytic Copilot uses two analyst personas:
- Coder with full retrieval tools, when the question is new and context must be fetched.
- Coder primed with similar solved examples, when prior solutions can short-circuit discovery.
The runtime can switch personas mid-session: if similar answers exist, lean on them; if context is insufficient, request more and reset to a retrieval-capable persona. That is strategy as state, not a single static system prompt.
In practice, this mirrors how a human analyst works. First time you see “sales by territory,” you look up definitions. The tenth time, you reuse the pattern.
Concept 6: Visualization Is Part of the Answer
Business users do not celebrate correct SQL. They celebrate insight they can see.
The pipeline chooses charts with intent: line for time trends, bar for category comparisons, pie only for small part-to-whole splits, scatter for two numeric measures, table when exact values matter. When the agent returns a DataFrame, heuristics can auto-suggest a chart so the UI is never “just a grid.”
That dual path (agent-authored Plotly figures and automatic chart suggestions from tabular shape) keeps the experience useful even when the model under-visualizes.
Concept 7: Streaming the Pipeline for Trust
Black-box BI assistants fail the trust test. If leadership cannot see how an answer was produced, they will not act on it.
Analytic Copilot streams Server-Sent Events as the agent moves through stages: understand, plan, context, generate, execute, respond. The React UI renders a live pipeline so you watch schema retrieval, generated code, SQL extraction, and final displays arrive in order.
Observability is a product feature, not a logging afterthought. The same events that power the UI are what you would later persist for audit, evaluation, and regression tests.
Concept 8: Conversation Hygiene
Multi-turn analytic chat fills context with tool payloads, intermediate tables, and failed code. Unbounded history destroys quality and cost.
Practical controls from the project:
- Keep only the last few questions.
- Strip detailed tool noise from older turns.
- Sanitize orphaned tool-call messages before sending history to the API.
- Isolate request-scoped runtime state so Streamlit and FastAPI can share the same agent core.
These details feel boring until you skip them. Then every follow-up question gets worse.
What I Would Tell You Before You Build One
If you are designing generative BI, start from concepts, not from a demo prompt:
- Define tools before prompts. What can the agent safely do?
- Encode business rules as data. Do not bury them in prose the model might ignore.
- Execute and observe. No loop, no reliability.
- Show the work. Pipeline visibility turns skeptics into collaborators.
- Treat charts as first-class outputs. Tables alone are not BI.
Text-to-SQL is a component. Generative BI is a system: context retrieval, tool-mediated code execution, self-correction, visualization, and transparent streaming. That is the architecture behind Analytic Copilot, and the architecture I keep coming back to whenever someone asks why “just ask the LLM for SQL” never quite ships.
New posts by email
I'll email you when I publish something new. Mostly AI agents, frontend, and things I'm learning on the job. Unsubscribe any time.